Sharing charts is a convenient way to share your market perspectives and forecasts with your friends or colleagues, or to your followers on various social media platforms and trading groups. You can share links to images of your charts, print them out, or you can post them directly to your Twitter account.
Also, shared charts can be easily loaded into a WaveBasis workspace as a live chart by clicking anywhere on the image of the chart that is displayed at the link. So, not only can you show your market perspectives to other traders, but by loading the live charts into your workspace you can easily collaborate on chart ideas and wave counts.
NOTE: Using the chart sharing feature is the preferred and recommended way to get support from the WaveBasis support team if you have questions about a specific chart or wave count. We’re able to provide the most effective, robust, and relevant support when we’re able to see exactly the chart that you’re analyzing. A picture speaks a thousand words, and a live chart speaks much more!
TIP: If you’d like to save the image of your chart as a file on your computer, then paste the link in a new browser tab. Once the chart image has loaded, right-click on the chart and save the image.
TIP: You can print shared charts directly from your browser, using your browser’s built-in print feature. Or, once you’ve saved the image file to your computer, you can print it the way you would print any other image file.
How do I do it?
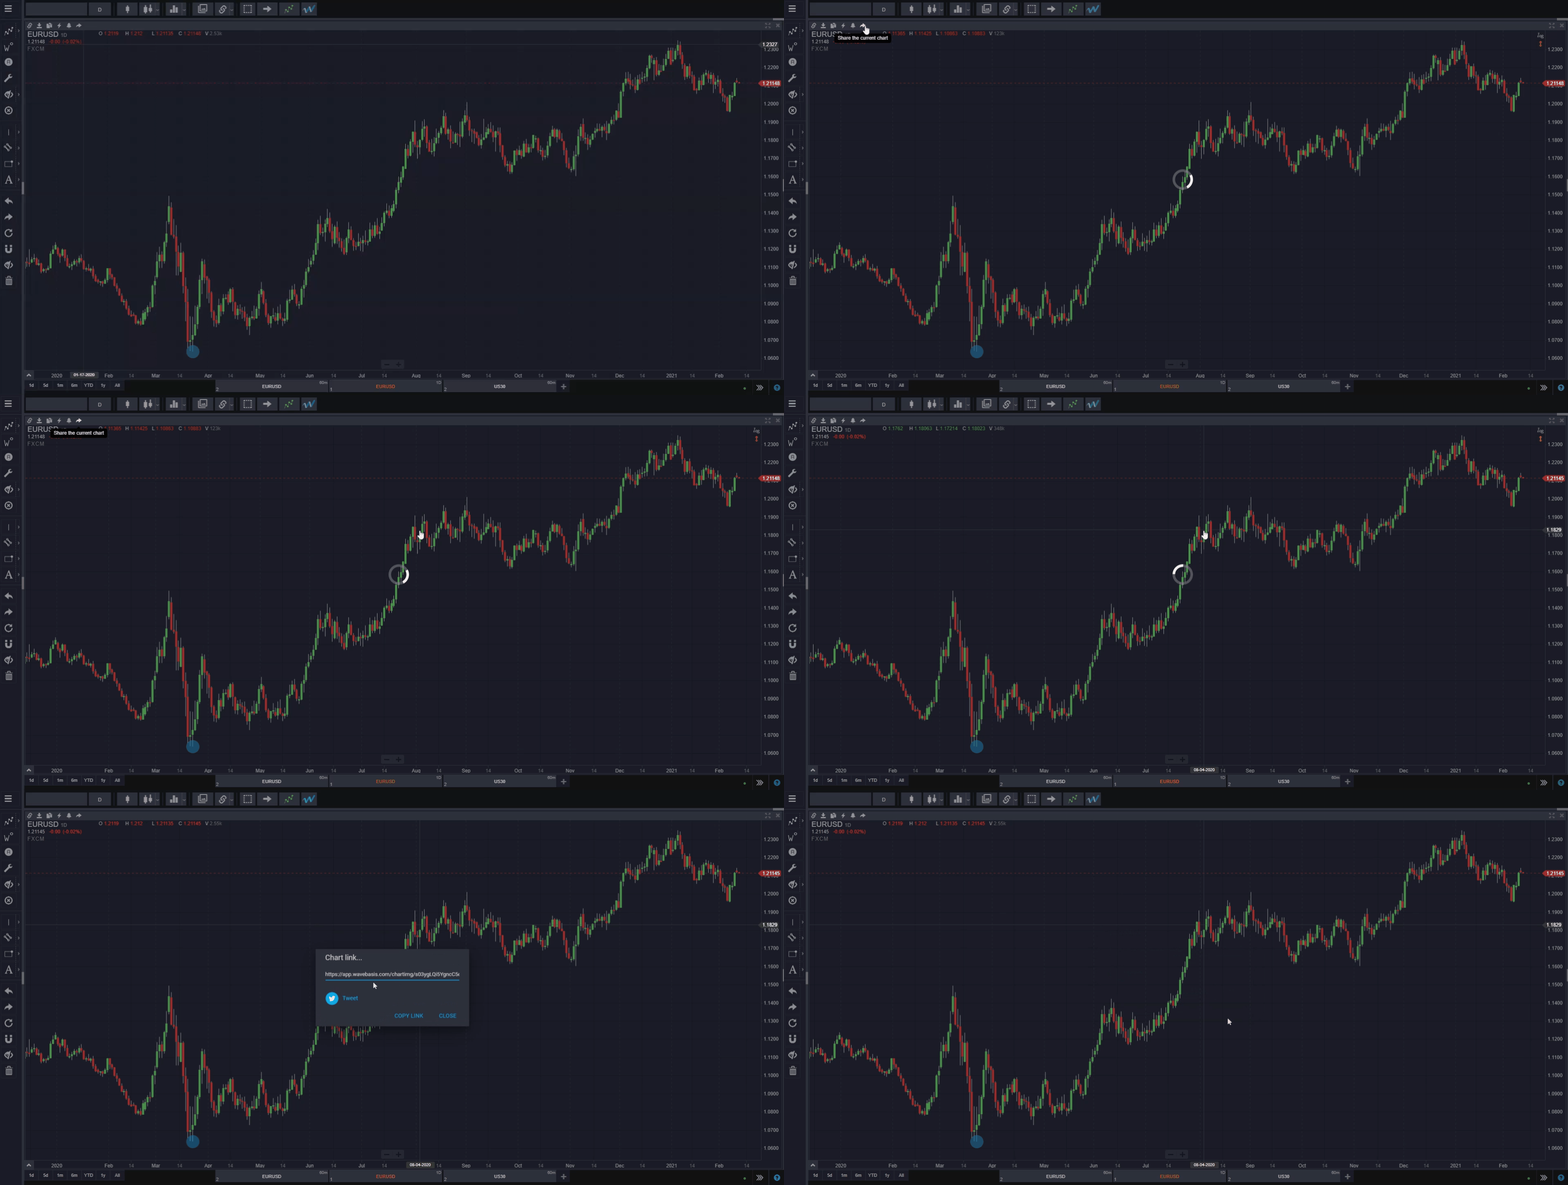
To share a chart, just click the “share the current chart” icon in the title bar at the top of the chart, as shown in the short video below. Your chart will then be converted to an image, and when this processing is finished, a link to the chart image will be displayed.
If you see a “Copy Link” button, then simply click it to have the link copied to your clipboard so that you can paste it somewhere else, such as an email or social media post, or directly in the address bar of your browser. If you don’t see a “Copy Link” button, then the link has already been copied to your clipboard, so you can go ahead and paste it where you like.
If you’d like to post your chart to Twitter, simply click the “Tweet” button.
