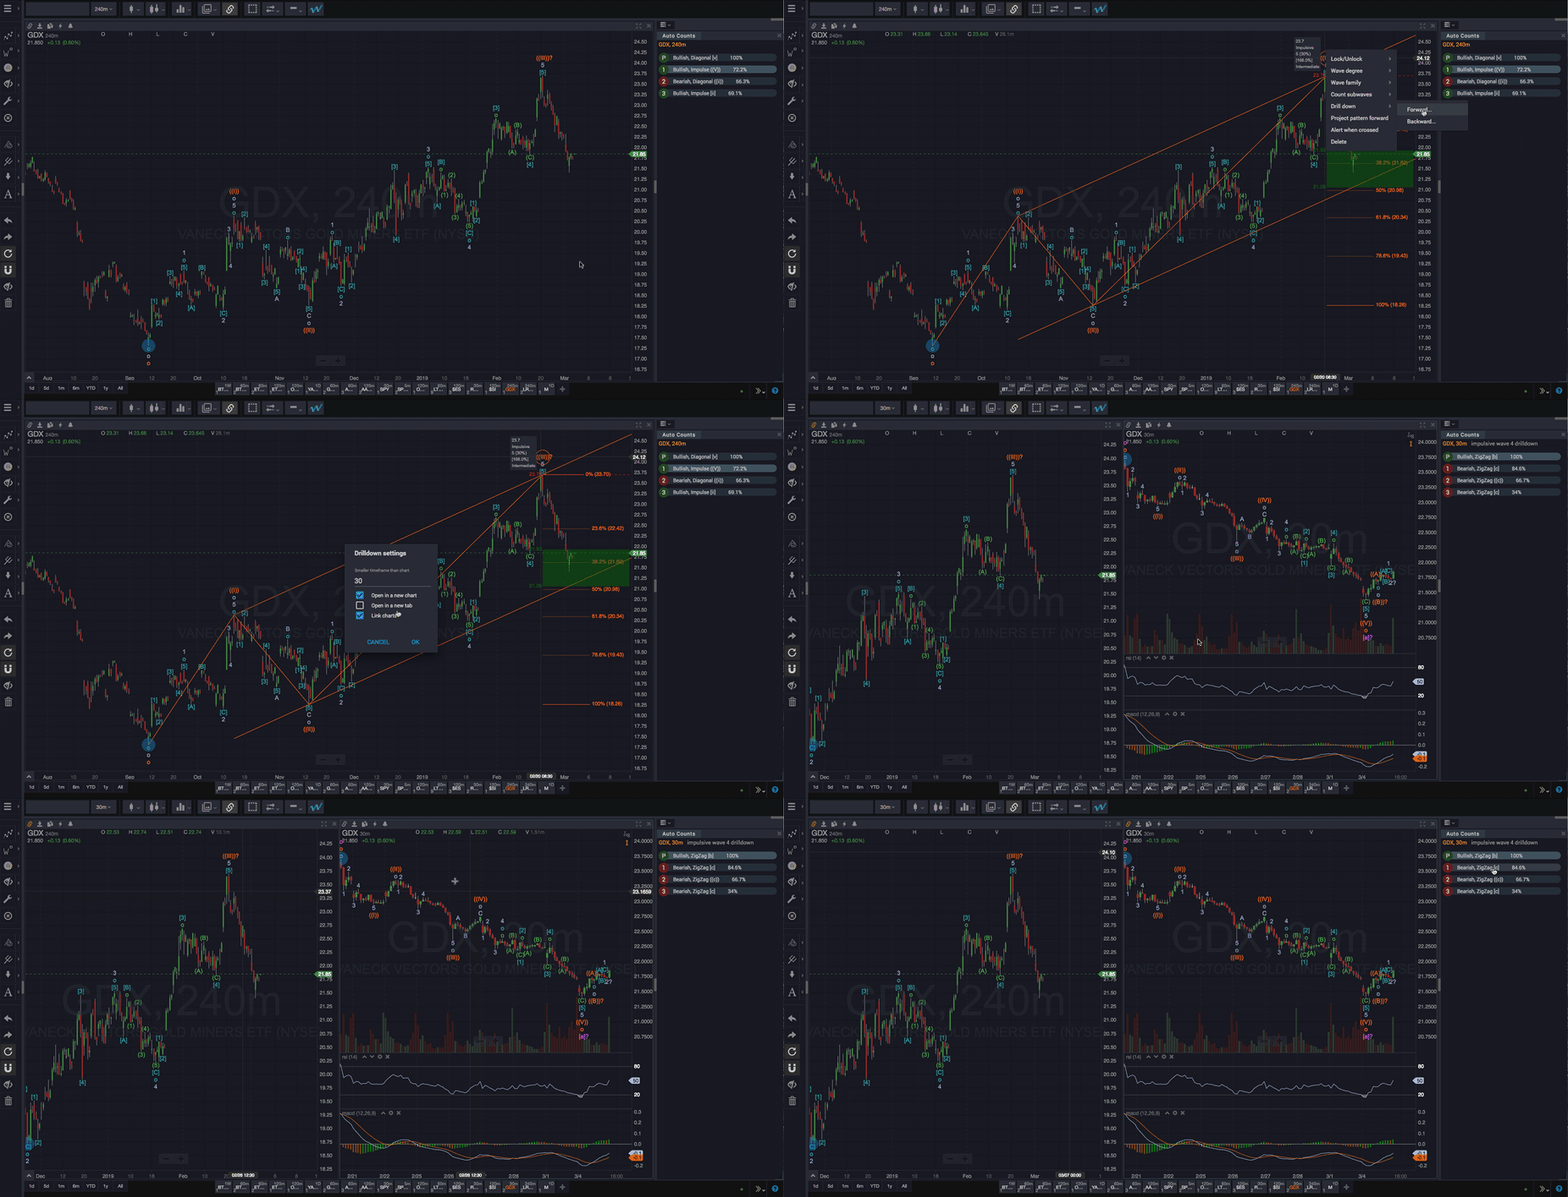
Studying multiple timeframes in parallel is a crucial aspect of mastering the Elliott Wave approach. The Drilldown feature greatly streamlines multi-timeframe analysis, allowing you to “zoom in” on a section of a wave count, while keeping the larger context in clear focus. This makes it extremely easy to refine your analysis toward taking trading action.
Drilling down is similar to Counting Subwaves, except the automatic subwave count that you compute will be at a lower timeframe than your existing wave count. So, instead of counting a subsection of an existing wave count at the same timeframe as your current chart, you can drill down to a lower timeframe to automatically generate wave patterns on that subsection.
This is an extremely powerful way to refine a wave count forecast. This is also an indispensable tool for establishing timing expectations for upcoming trade entry/exit opportunities.
Also, when combined with the Alternate Wave Counts gadget, drilling down to lower timeframes is an efficient way to quickly understand and objectively manage risk.
How do I do it?
First, you’ll need to have a wave count (or at least an individual pattern) on your chart. You can accomplish this by running an automatic wave count, however, the Drilldown feature also works with manually drawn waves. Then…
- Right-click on a wave in an area of interest
- Choose Drill down
- Choose Forward or Backward, depending on whether you’d like to analyze the area after or before the wave you right-clicked.
The Drilldown settings dialog will open with a few options…

- Enter a chart resolution/timeframe using abbreviated format. The timeframe should be smaller than the current chart’s. For example, if the chart is a daily chart, you can enter “60” to drill down to 60-minutes.
- By default, the drilldown results will be opened in a new chart which will be added to your current tab, uncheck this box if you prefer to replace the current chart with the new drilldown chart.
- If you want the new drilldown chart to open in a new tab, check the Open in a new tab checkbox
- If you check Link charts, your charts will automatically be linked after the drilldown wave count is calculated. The is very useful for keeping yourself oriented within the larger timeframe context when you switch your attention to the smaller timeframe wave count. This option is only valid when Open in a new chart is also checked.
When should I use it?
There are two main scenarios when drilling down is useful…
With completed waves
You can drilldown to count the subwave patterns between existing waves in a wave count or pattern. This can be useful for confirming internal subwave structure between existing waves in a wave count at smaller timeframes. This can be important when interpreting or evaluating the count, or when comparing counts, for example. You can drill down between completed waves either forward or backward in time,
With incomplete patterns
This is the most common and most powerful way to use the Drilldown feature. It can also be used to count, re-count, or update unconfirmed pattern areas in evolving wave patterns at the end of a wave count. This is accomplished by right-clicking a wave with a question mark [?] next to it, then following the steps noted above. Drilling down with completed waves (as described above) is great way to more closely evaluate previously completed sections of an established wave count. Using it with incomplete patterns can be the most effective way to track a live market through still-evolving patterns.
This can be particularly useful for quickly refining your lower timeframe structure expectations as patterns near-completion around anticipated market turning points. This not only helps you more seamlessly anticipate pattern twists and turns, particularly on smaller timeframes, but it also helps you maintain a consistent sense of overall larger timeframe context regardless of your trading timeframe. Drilling down at the end of incomplete patterns is also a great technique for refining timing on trade entries/exits.
Alternate drilldown wave counts
When using the drilldown feature with incomplete patterns as described above, the integrated Alternate Wave Counts gadget will display a primary count and up to 3 alternate drilldown wave counts for the relevant area of the chart.
If the Alternate Wave Counts gadget isn’t already visible, you can add it to either of the gadget areas in your workspace as described in the gadgets section. Combining timeframe drilldown analysis with the Alternate Wave Counts Gadget is a powerful way to track multiple evolving count possibilities simultaneously. This is a key aspect of gauging and managing risk as patterns evolve. It can also be instrumental in identifying low risk, high-probability entry points.
