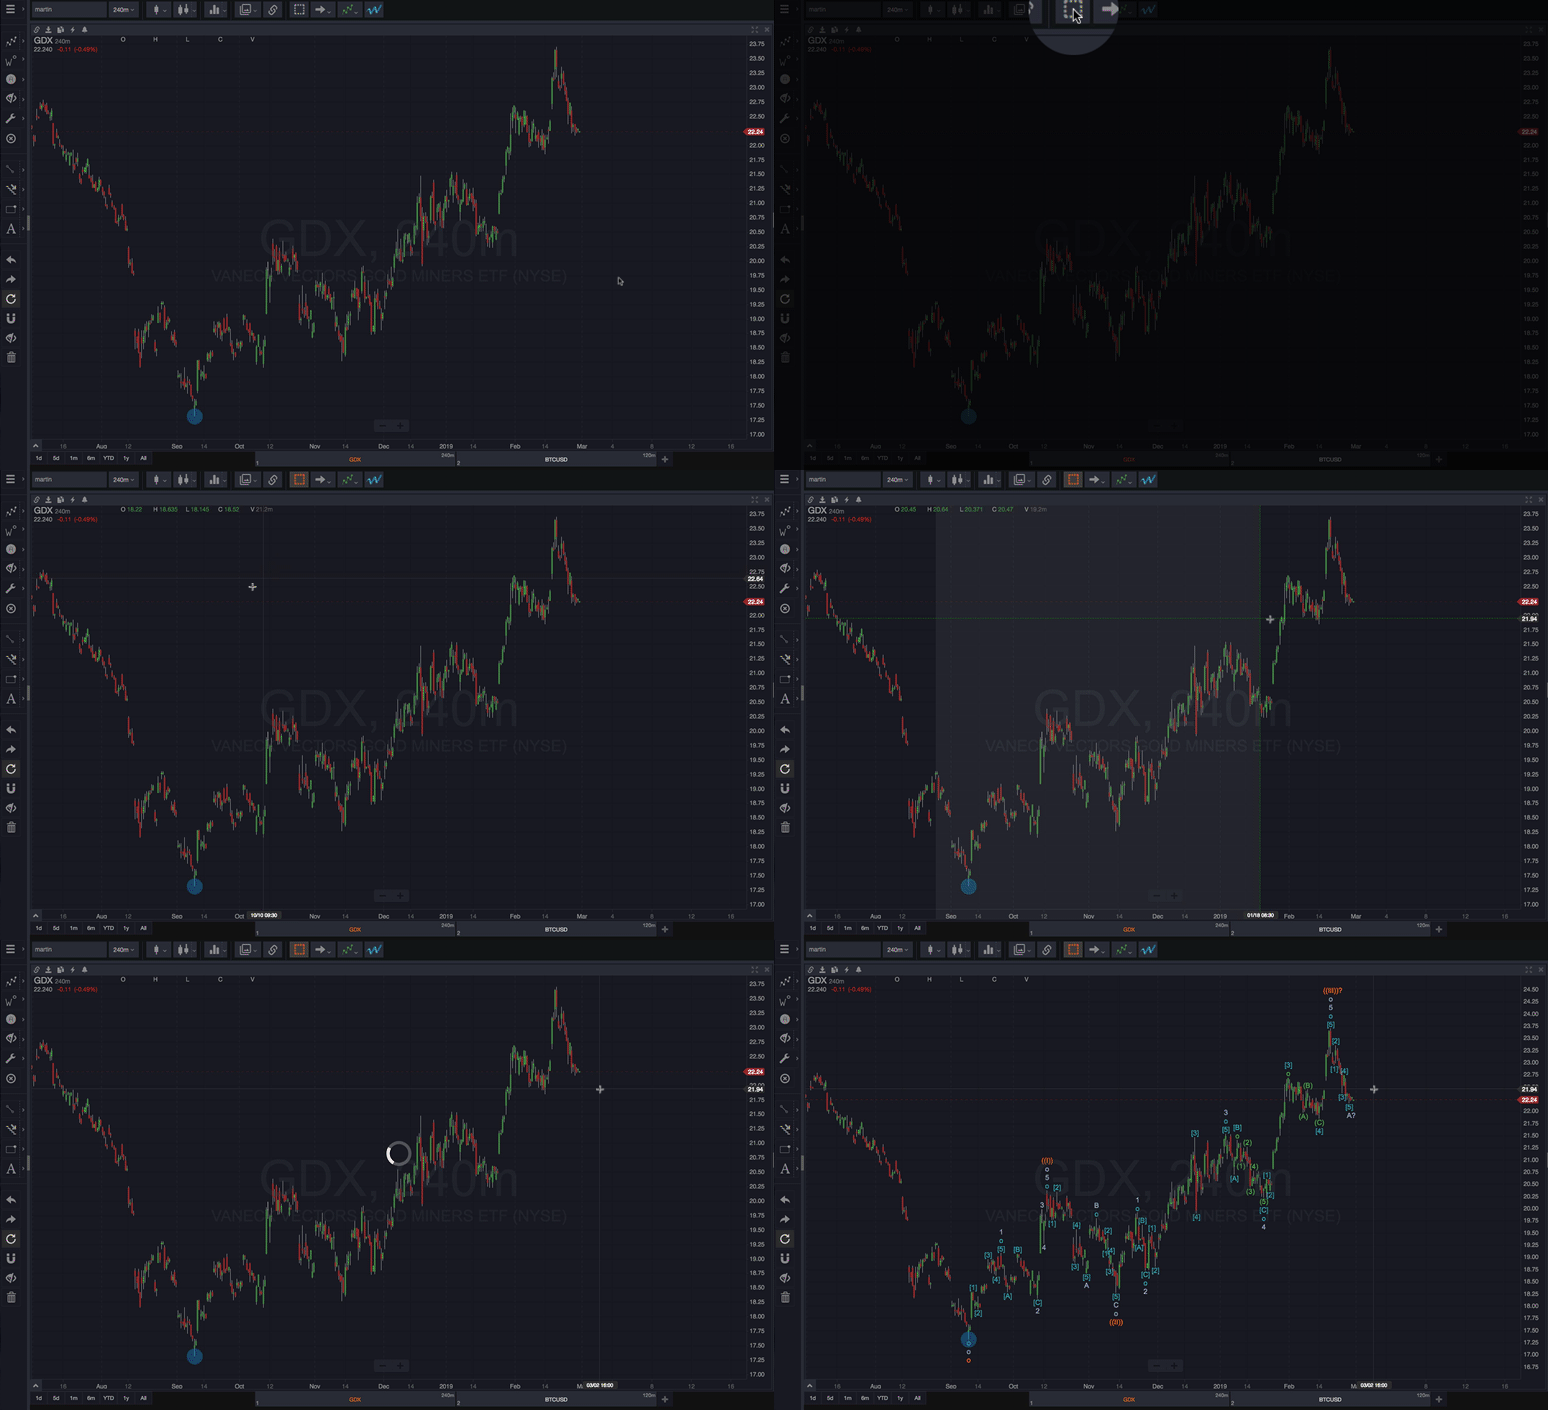
This technique can be used as a way to analyze a specific subsection of a chart, or simply as a convenient alternative to traveling up to the top toolbar. Select a chart range to count following these steps as demonstrated below:
- Enable the Range Selection Tool
- Click on the chart where you would like to start the count (just “click”, don’t hold to drag)
- Click again where you would like the count to end
Immediately after you click the second time, an automatic wave count will be calculated on the highlighted area of the chart. If you want to change your selection after clicking the first time, simply hit the ESCape key on your keyboard.
NOTE: You can use this tool repeatedly without having to enable it before each use by simply enabling the “Draw Continuously” tool in the lower left toolbar.
