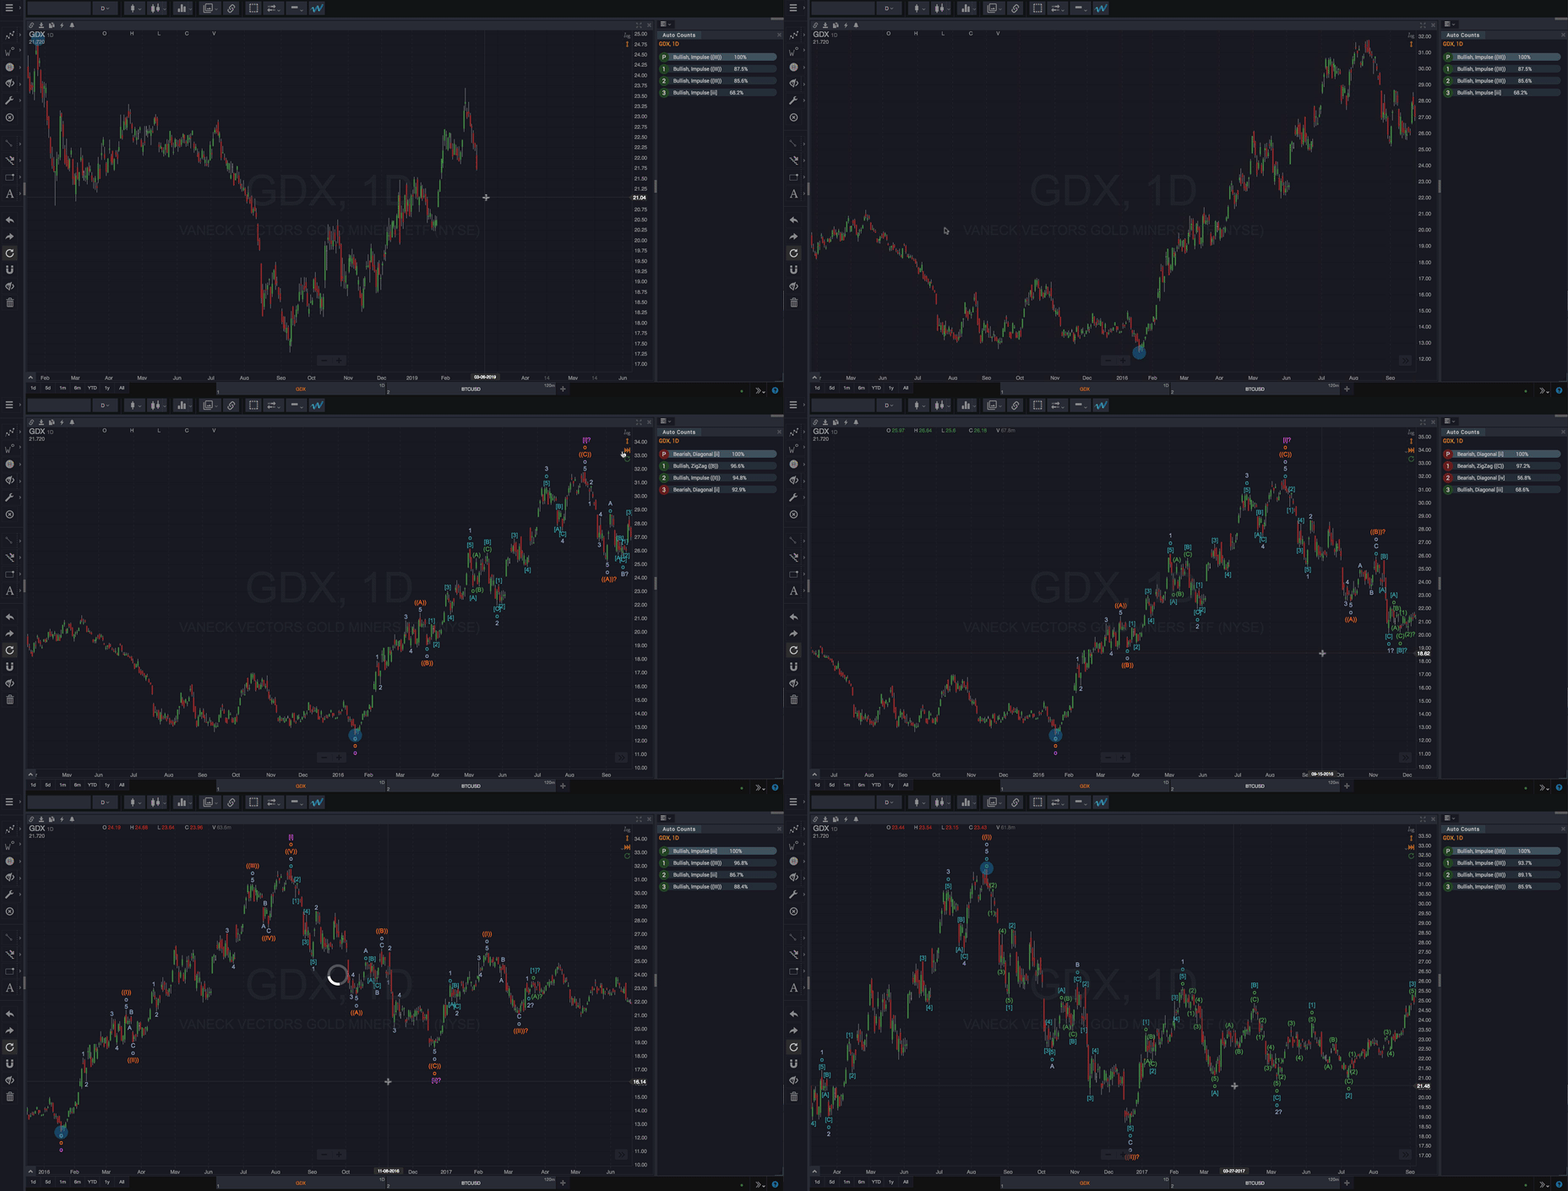
The AutoSync feature runs an automatic wave count each time you scroll a chart forward in time. This is intended to help simulate what might have happened in the past as Elliott Wave counts evolved. This similar to “playing back” past Elliott Wave counts, and can be useful for getting a feel for automatic wave counts by inspecting past market periods.
The AutoSync icon displays with the other price axis tools in the upper right corner of the chart. The axis tools display only when the mouse cursor is hovering over the chart. The AutoSync icon will only display after you’ve run an automatic wave count on the chart.
Also, the small arrow next to the icon opens a menu giving you options for the two AutoSync modes.
NOTE: It is strongly recommended that you combine the Alternate Wave Counts gadget with the AutoSync feature. Assessing alternate wave counts when analyzing past market periods is the best way to evaluate how your actual analysis might have proceeded during those past periods.

To activate AutoSync:
- Set the Date Range option to Visible chart range or a fixed number of bars
- Scroll the chart back in time so that more recent bars are hidden off of the right edge of the chart.
- Run an automatic wave count using the blue ‘W’ icon (as described here). The wave count will only include the range of the chart that is visible on your screen. So, be sure that you’ve included a time range (especially the starting point) that is sensible for your trading objectives, as described in previous sections.
- Click the AutoSync icon in the upper right of a chart, next to the price axis. The icon will turn yellow when it is enabled.
- Choose an AutoSync Mode as described below by clicking on the arrow next to the icon and choosing an option from the dropdown menu that appears.
AutoSync Modes
Walk Forward
This will keep a fixed starting point as each new AutoCount is calculated. This means the number of bars included in the wave count analysis will increase with each new AutoCount. This is the default, and except in special circumstances will generally give the best results. Also, this mode works best when the Date Range is set to Visible chart range.
For example, if there are 311 bars in the current AutoCount, and you pan/scroll forward 5 bars, a Walk Forward AutoSync will run a new AutoCount with the last 316 bars included in the analysis.
Slide Forward
This will keep a fixed number of bars as each new AutoCount is calculated. This, in effect, slides a fixed window forward in time. So, if your Date Range is set to the “Last 250 bars”, the AutoCount will always include the last 250 bars as you pan/scroll forward in time. This more works best when the Date Range is set to a fixed number of bars.
Some notes
- Both AutoSync modes always use the last visible bar on the chart as the ending date of the AutoCount.
- AutoSync will only trigger (causing a new AutoCount to calculate) when the chart is panned/scrolled forward using the click-and-drag technique. This makes it easy to control when new wave counts are calculated, while still being able to move and navigate around the chart freely using other techniques.
- When you are in AutoSync mode you can continue to use other other analysis tools, including drawing tools, interactive gadgets, and counting subwaves.
- To reset AutoSync mode simply scroll the chart back in time to where you’d like to start, and use the blue ‘W’ to compute a new automatic wave count.
